Automatic phase correction of NMR spectra
This notebook demonstrates automatic phase correction algorithms implemented for nmrglue. Two standard algorithms are implemented:
- ACME algorithm by Chen Li et al. Journal of Magnetic Resonance 158 (2002) 164-168
- Naive peak minima minimisation
The outputs for the two algorithms are shown below. Automatic phase correction can be used through the addition of an autops function to the proc_base set alongside the algorithm name to employ for scoring of phase. Custom algorithms can be provided via the same parameter.
import nmrglue as ng

dic, data = ng.bruker.read("/Users/mxf793/Data/THPNH/Extract/1d/103/")
data = ng.bruker.remove_digital_filter(dic, data)
import matplotlib.pyplot as plt
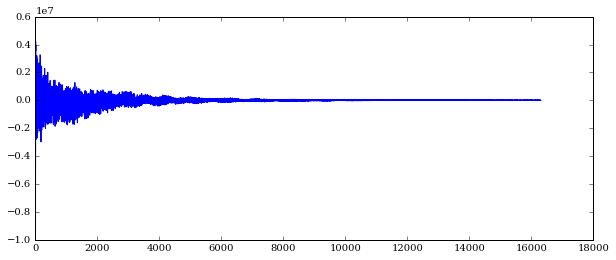
plt.figure(figsize=(10,4))
plt.plot(data)
/usr/local/lib/python2.7/site-packages/numpy/core/numeric.py:462: ComplexWarning: Casting complex values to real discards the imaginary part
  return array(a, dtype, copy=False, order=order)


[<matplotlib.lines.Line2D at 0x10cc7d090>]
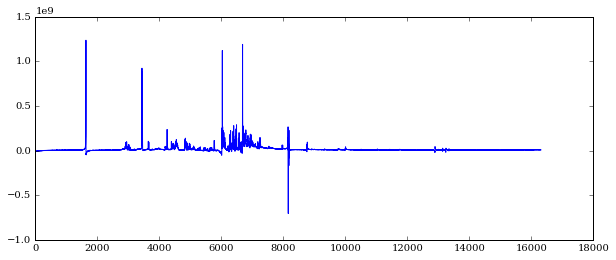
data_fft = ng.proc_base.fft(data)
plt.figure(figsize=(10,4))
plt.plot(data_fft)
[<matplotlib.lines.Line2D at 0x10d0588d0>]
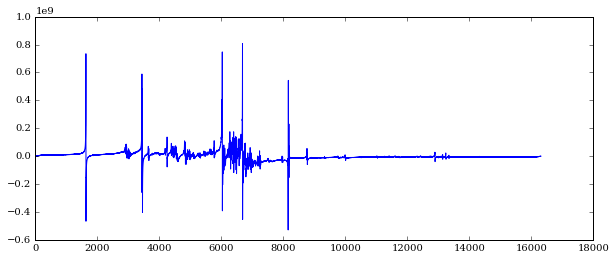
data_pc_pm = ng.proc_base.autops(data_fft,'peak_minima')
Optimization terminated successfully.
         Current function value: 0.000037
         Iterations: 90
         Function evaluations: 165
plt.figure(figsize=(10,4))
plt.plot(data_pc_pm)
[<matplotlib.lines.Line2D at 0x10d2e6710>]
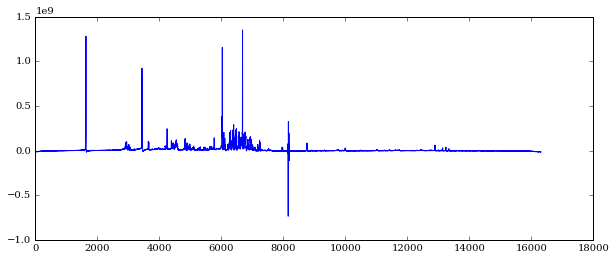
data_pc_acme = ng.proc_base.autops(data_fft,'acme')
Warning: Maximum number of function evaluations has been exceeded.
plt.figure(figsize=(10,4))
plt.plot(data_pc_acme)
[<matplotlib.lines.Line2D at 0x10d4db850>]